Key points
- Market cap = price × circulating supply. FDV = price × max supply. Both multiply today's price by tokens that were never sold at that price.
- Market cap is not money invested. A $500 buy can create a "$10 million" market cap, and nobody can take $10 million out.
- Liquidity is the only number about selling. On a DEX it is a pool of two assets, and only one side is what sellers receive.
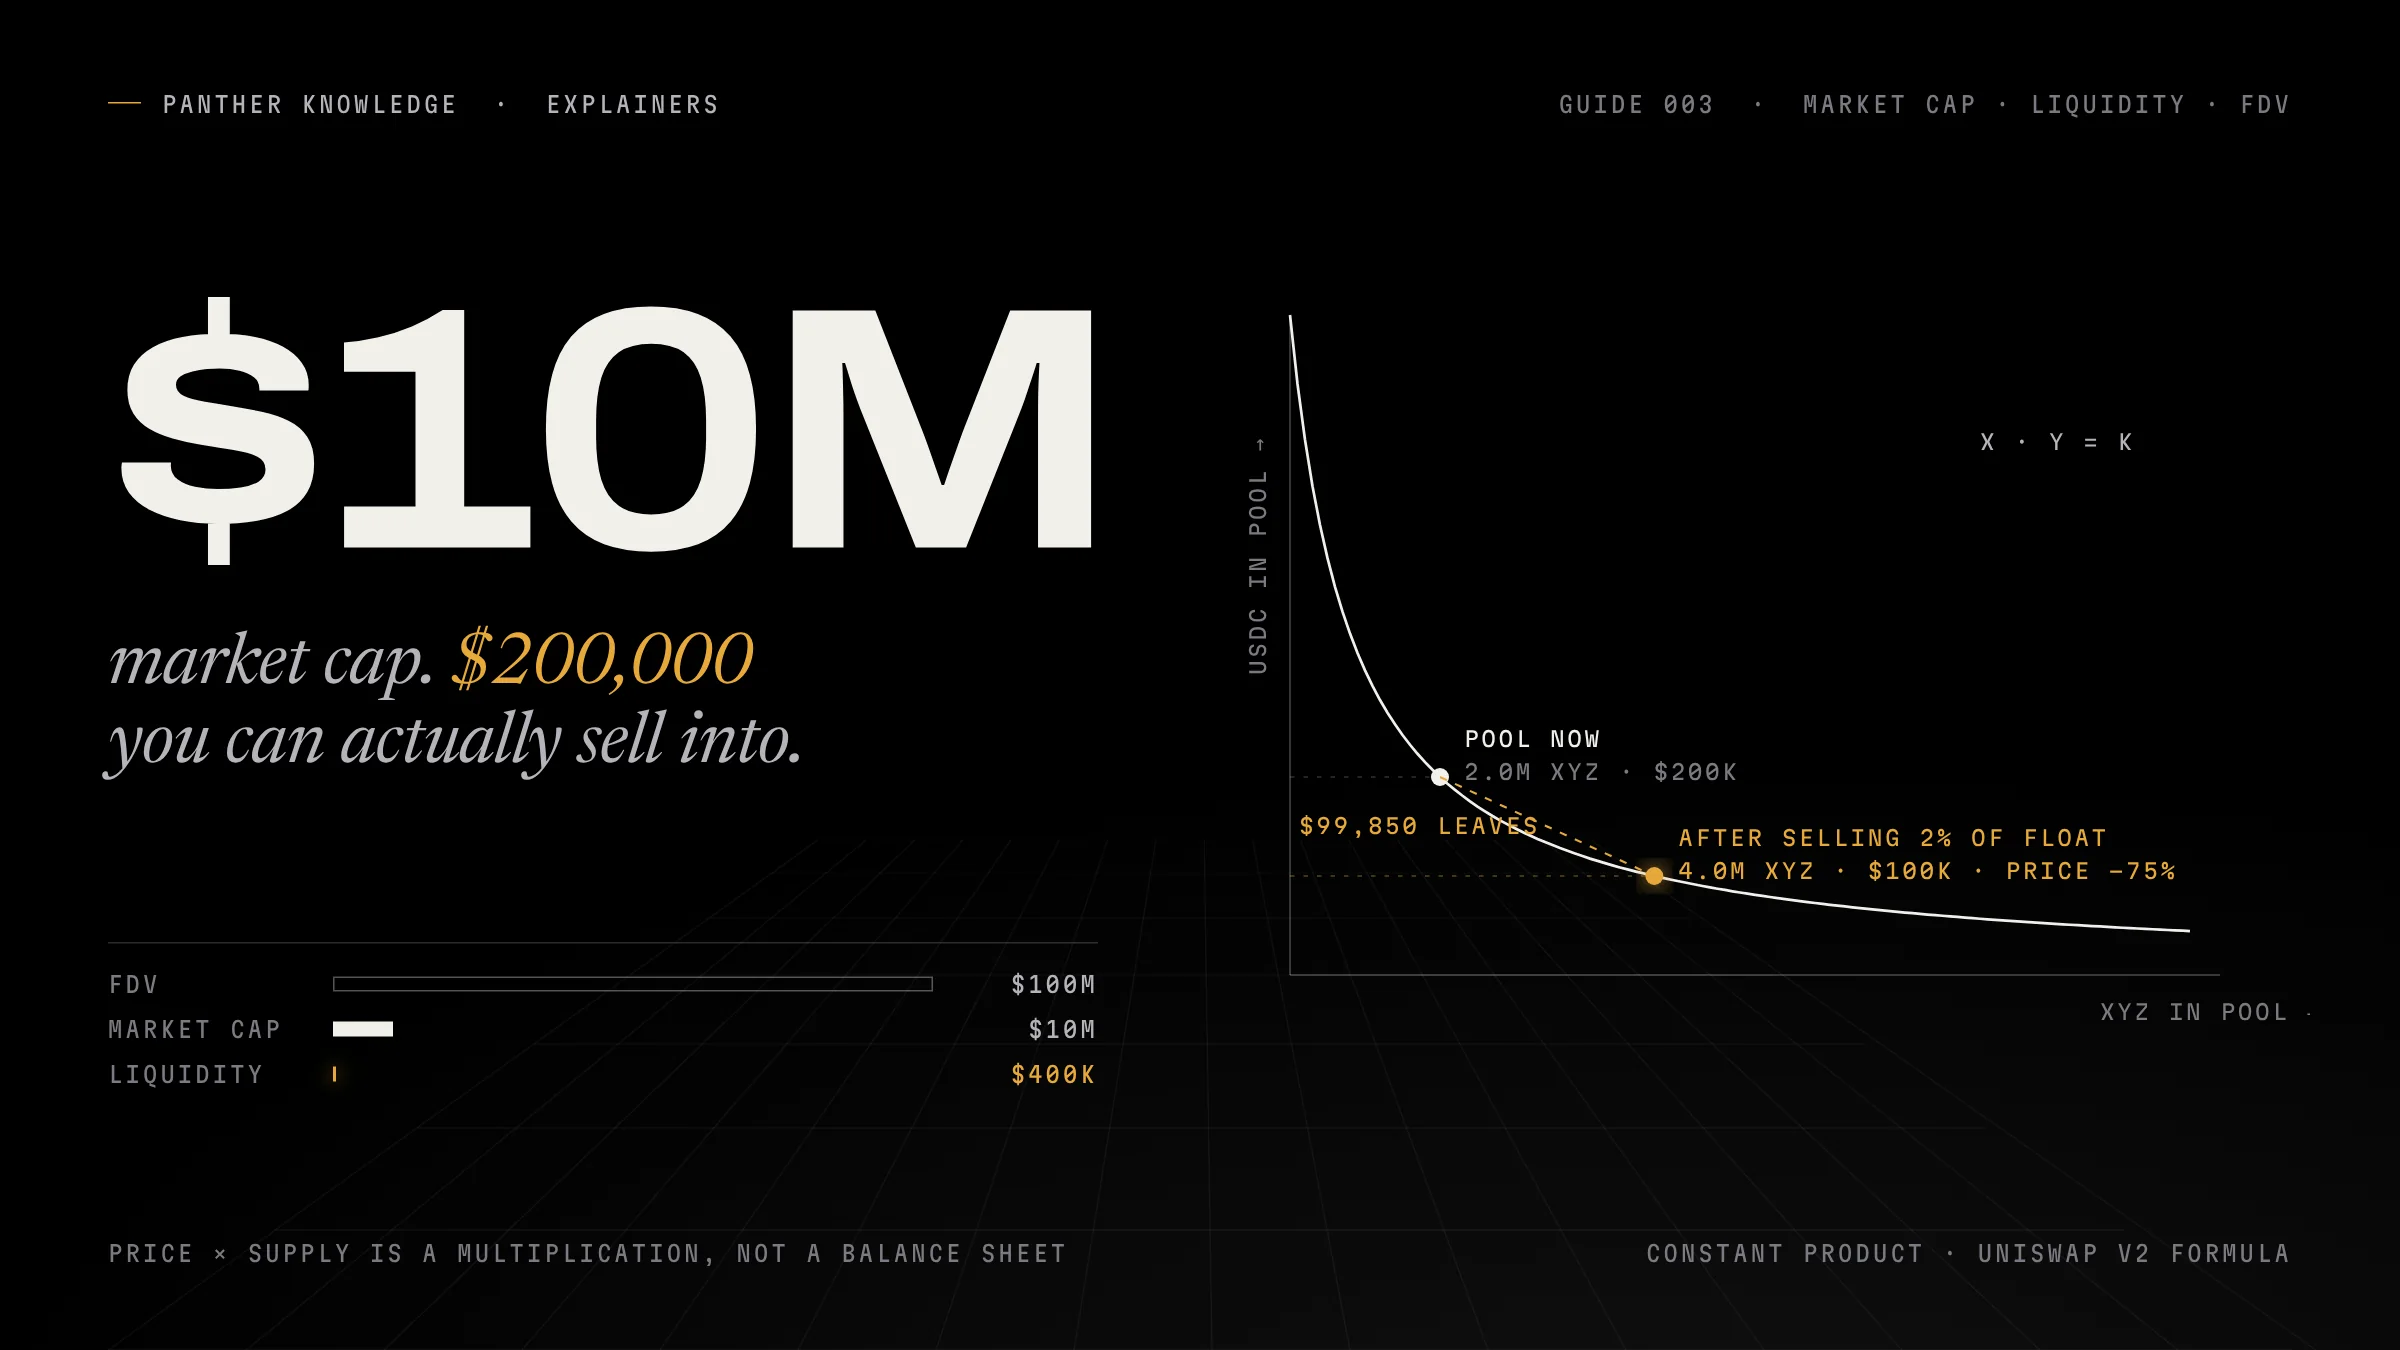
- On the Uniswap v2 formula, selling 2% of a token's float into a $400K pool returns $99,850 and cuts the price by 75%.
- Price impact is caused by your trade's size. Slippage is caused by other trades landing before yours. Both come out of your pocket.
- Read liquidity ÷ market cap, the sell side only, and market cap ÷ FDV together before sizing a position.
A token page shows three big numbers: market cap, fully diluted valuation and liquidity. People trade off the first one, get surprised by the second one a year later, and lose money to the third one on the way out. They measure different things, and only one of them tells you what happens when you press sell.
This guide defines each number the way the data providers actually compute it, then walks through a worked example on a real automated-market-maker formula so you can see why a “$10 million” token can be impossible to sell for $10 million, or even $1 million.
Three supplies, three valuations
Every valuation number is a price multiplied by a supply, and there are three supplies to choose from. The definitions below are the ones CoinMarketCap and CoinGecko publish.
| Supply | What it counts | Who defines it |
|---|---|---|
| Circulating supply | Tokens that are tradable in public, excluding team, treasury and locked allocations. CoinGecko computes it as total supply minus verified locked tokens, using data from the team. | The project reports it; trackers verify what they can |
| Total supply | Everything minted so far, minus verifiably burned tokens | Readable onchain for most tokens (totalSupply()) |
| Max supply | The most that will ever exist, minus burns. Many tokens have none | Set by the token’s rules, if it has them |
From those:
- Market capitalization = price × circulating supply. This is the number trackers rank by.
- Fully diluted valuation (FDV) = price × max supply, the “maximum market cap” if every token were in circulation. Where a token has no max supply, trackers substitute total supply or show nothing, so the same token can carry different FDVs on different sites.
- Some trackers also publish variants, such as a minted market cap (price × total supply) or an unlocked market cap.
Both numbers take today’s price as a given and stretch it over a quantity of tokens that has never been sold at that price. That is the whole problem.
Market cap is not money invested
The last trade sets the price. If a token has 100 million circulating tokens and someone buys $500 worth, pushing the price to $0.10, every tracker now reports a $10 million market cap. Nobody paid $10 million. Nobody could get $10 million out. The figure is a multiplication, not a balance sheet.
It is still useful. Market cap ranks tokens, it is comparable across projects, and a token at $10 million market cap needs far less new money to double than one at $1 billion. Just read it as “price times a count”, never as “the money in this project”.
FDV is the same multiplication with the tokens that have not arrived yet
A token with 100 million circulating and 1 billion max supply at $0.10 has a $10 million market cap and a $100 million FDV. The 900 million tokens that are not circulating belong to someone: investors, the team, a treasury, a staking emission schedule. They will be sold or at least sellable later.
The ratio matters more than either number. Market cap ÷ FDV = 0.10 here, meaning 90% of eventual supply has not reached the market. For the price to hold while that supply unlocks, buyers must absorb nine times the current float. That rarely happens quietly, which is why “low float, high FDV” launches tend to grind down for months.
Check three things on an FDV: whether a max supply actually exists (if not, the FDV is a guess), the unlock schedule for the gap, and who holds the locked portion.
Liquidity is the only number about selling
Market cap and FDV describe a price. Liquidity describes how much the price moves when someone trades, and that depends on where the token is traded.
On a centralized exchange, liquidity is the order book: resting bids and asks at each price level. Depth charts show how much can be bought or sold before the price moves a given percentage. Bids can be pulled instantly; depth is a snapshot.
On a decentralized exchange like Uniswap, PancakeSwap or the launchpad pools on Base and Robinhood Chain, liquidity is a pool of two assets whose product stays constant: x × y = k. Uniswap’s documentation puts the consequence in one line: “larger trades (relative to reserves) execute at exponentially worse rates than smaller ones.”
The “liquidity” figure on a token page is usually the dollar value of both sides of the pool added together. Only one side is what sellers receive. If a pool holds 2,000,000 XYZ and 200,000 USDC, the page will say “$400k liquidity”, and the entire sell-side capacity, if every seller accepted a price of zero, is $200,000. In practice it is far less, as the next section shows.
A worked example on the real formula
Uniswap v2 computes the output of a trade with this function, from its published library (the 997/1000 is the 0.30% fee):
amountInWithFee = amountIn × 997
amountOut = (amountInWithFee × reserveOut)
          ÷ (reserveIn × 1000 + amountInWithFee)
Take the token above: 100 million circulating, 1 billion max, $0.10 spot, a $10 million market cap and a $100 million FDV, and a single pool of 2,000,000 XYZ against 200,000 USDC. Here is what sellers actually receive:
| You sell | Worth at spot | You receive | Effective price | Price impact | Pool price after |
|---|---|---|---|---|---|
| 50,000 XYZ | $5,000 | $4,864 | $0.0973 | 2.7% | $0.0952 |
| 500,000 XYZ | $50,000 | $39,904 | $0.0798 | 20.2% | $0.0640 |
| 2,000,000 XYZ (2% of float) | $200,000 | $99,850 | $0.0499 | 50.1% | $0.0250 |
| 5,000,000 XYZ (5% of float) | $500,000 | $142,734 | $0.0285 | 71.5% | $0.0082 |
Read the third row again. Selling 2% of the circulating supply, which the tracker values at $200,000, returns $99,850 and cuts the quoted price by 75%. The market cap on the tracker drops from $10 million to $2.5 million from one trade, and the remaining 98 million tokens are now “worth” $0.025 each. The pool never held $10 million; it held $200,000, and half of that was all one seller could reach.
Buying is the mirror image. $50,000 of USDC into the same pool buys 399,039 XYZ at an effective $0.1253, and leaves the pool price at $0.156, so the next buyer pays 56% more than the price you started from. That is also why thin pools pump so easily, and why the pump means nothing until the pool can absorb the exit.
Price impact versus slippage
Two words that get swapped for each other:
- Price impact is the change in price caused by your own trade’s size relative to the pool. Uniswap’s definition: “the change in token price directly caused by your trade.” The table above is price impact.
- Slippage is the difference between the price you expected when you clicked and the price you got, caused by other trades landing before yours. You cannot control it, only cap it with a slippage tolerance; the trade reverts if the market moves past the cap.
A large price impact is visible before you sign. Slippage is not. Both come out of your pocket, and a wide slippage tolerance on a thin pool is how sandwich bots get paid, which has its own guide on the Explainers shelf.
Reading the three numbers together
A quick way to put a token page in proportion:
- Liquidity ÷ market cap. Divide the pool’s total value by the market cap. The example token is 4%. Established tokens on deep venues run far higher; a new memecoin at 1–5% means a few holders can clear the pool.
- Sell-side only. Halve the liquidity figure for the usable side, then assume you can extract perhaps a quarter of that before impact becomes punitive.
- Market cap ÷ FDV. Below 0.2 means most supply is still to come. Find the unlock dates.
- Where the liquidity is. One pool on one chain, or several venues including an order book? One pool can be withdrawn by whoever holds the LP tokens, which is the subject of the liquidity-lock guide on the Security shelf.
- Who the holders are. Ten wallets holding 60% of the float means the liquidity table above is their exit, and you are the pool.
Checklist before you size a position
| Question | Where to look |
|---|---|
| Is the market cap built on circulating or total supply? | Tracker’s supply fields; compare to totalSupply() onchain |
| Does a max supply exist, and what is market cap ÷ FDV? | Tracker; tokenomics documents; unlock schedule |
| How much sell-side liquidity is actually in the pool? | The pool contract or DEX analytics; take the quote-asset side only |
| What does a sale of your intended size return? | Simulate it in the DEX interface before buying; the price impact field |
| Can the liquidity leave? | LP token holder, lock or burn status |
Sources
- 01CoinGecko methodology: market capitalization and circulating supply · CoinGeckowww.coingecko.com/en/methodology
- 02Supply: circulating, total and max; fully diluted valuation · CoinMarketCapsupport.coinmarketcap.com/hc/en-us/articles/360043396252-Supply-Circulating-Total-Max-
- 03How Uniswap works: the constant product formula · Uniswap Docsdocs.uniswap.org/contracts/v2/concepts/protocol-overview/how-uniswap-works
- 04UniswapV2Library.sol: getAmountOut · Uniswap on GitHubgithub.com/Uniswap/v2-periphery/blob/master/contracts/libraries/UniswapV2Library.sol
- 05What is price impact? · Uniswap Supportsupport.uniswap.org/hc/en-us/articles/8671539602317
- 06What is price slippage? · Uniswap Supportsupport.uniswap.org/hc/en-us/articles/8643879653261
- 07Uniswap v3 fee tiers · Uniswap Docsdocs.uniswap.org/concepts/protocol/fees
Responses
No responses yet. Start the conversation.
Panther Journal — The intelligence brief
Stay ahead of the story.
Free. New investigations delivered when published. Unsubscribe anytime.