Key points
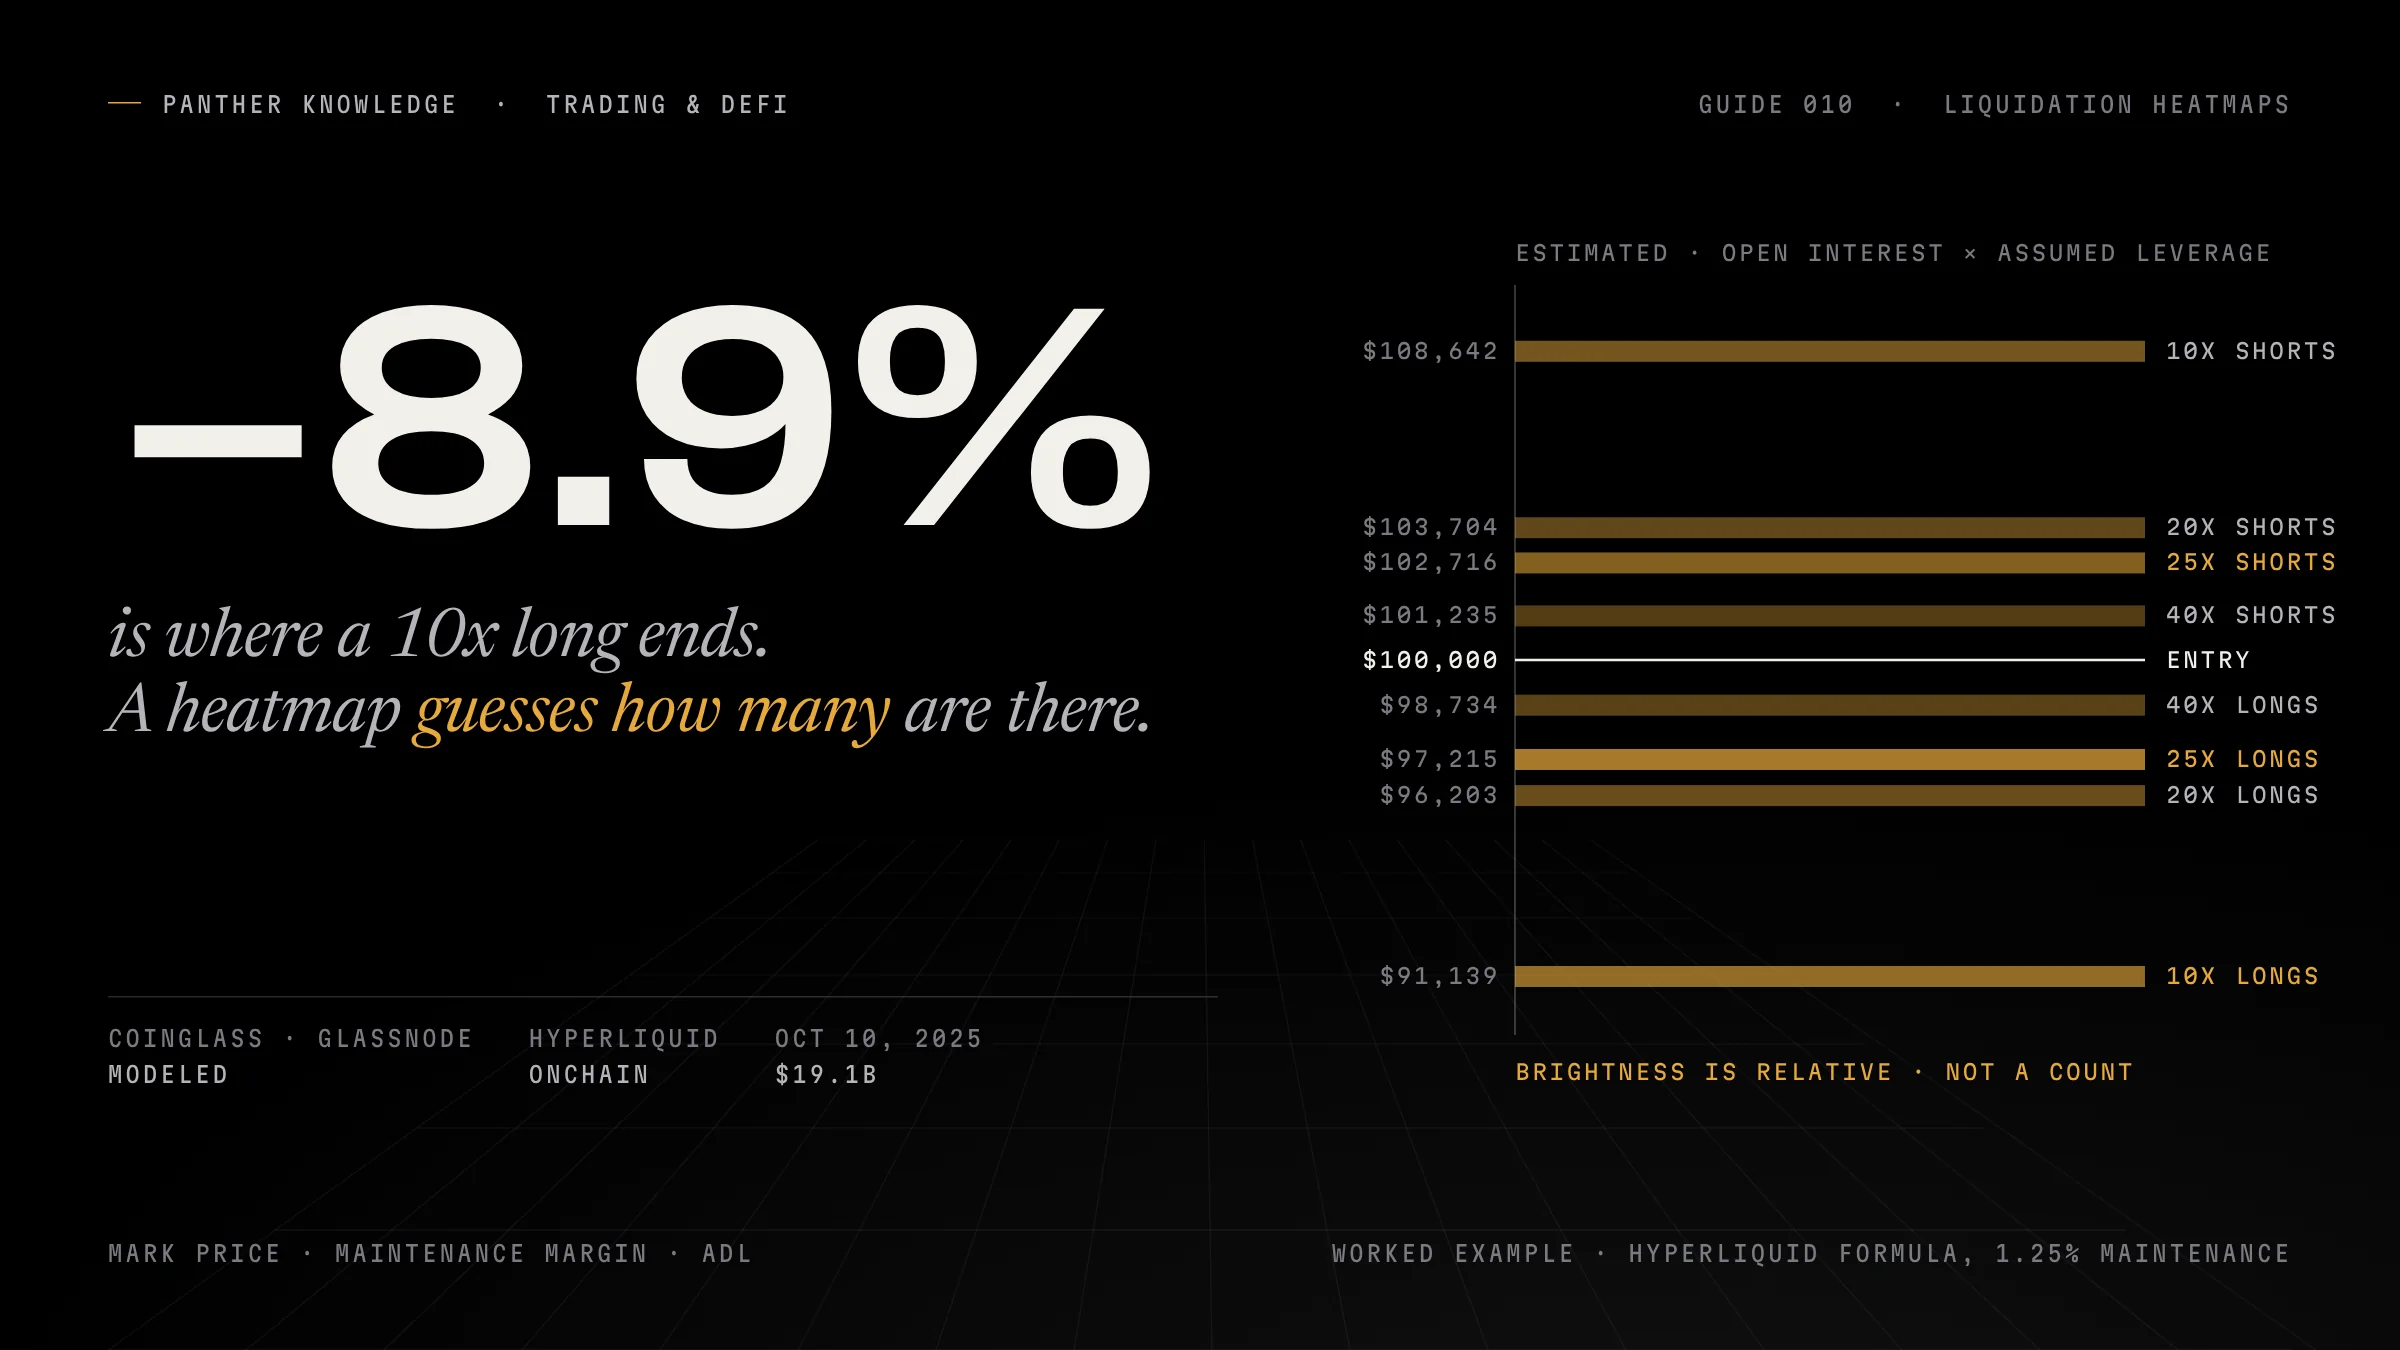
- A position is liquidated when collateral falls below maintenance margin, measured on the mark price. At 10x with 1.25% maintenance, a long from $100,000 ends at $91,139.
- Centralized exchanges do not publish liquidation prices, so their heatmaps estimate them from open interest, price history and assumed leverage.
- Brightness is relative to the view or period, and CoinGlass says actual liquidations are often lower than the map shows.
- Margin top-ups, funding, partial liquidations, insurance funds and auto-deleveraging all move or shrink the bands.
- Hyperliquid and Aave positions are public, so their liquidation levels can be read from the chain, not modeled.
- In the October 10, 2025 crash about $19.1B was liquidated; even that figure is an estimate because Binance publishes at most one liquidation per second per pair.
A liquidation heatmap paints bright bands across a price chart: here, the picture says, a lot of leveraged positions would be forced closed. Traders screenshot them, call the bands “magnets” and expect price to go there. Some of that is reasonable. Much of it misreads what the picture is.
On centralized exchanges, nobody outside the exchange can see where individual positions would be liquidated. A heatmap from those venues is a model: an estimate built from open interest, price history and assumptions about leverage. This guide shows how liquidation prices are actually calculated, how the main providers build their maps, how to read one, why the bands are not a forecast, and what the October 2025 crash showed about every number involved.
What gets liquidated, and at what price
A leveraged position stays open while its collateral covers the exchange’s maintenance margin. Binance’s trigger: “Collateral = Initial Collateral + Realized PnL + Unrealized PnL < Maintenance Margin.” OKX triggers forced liquidation when the maintenance margin ratio “is less than or equal to 100%.” Every major venue measures this on the mark price, not the last trade: OKX says plainly that forced liquidation “only looks at the mark price, not the last traded price.”
Hyperliquid publishes the full formula:
liq_price = price − side × margin_available / position_size / (1 − l × side)
l = 1 / MAINTENANCE_LEVERAGE
where side is 1 for a long and −1 for a short. Its maintenance margin ranges from 1.25% for assets with 40x maximum leverage to 16.7% for 3x assets.
Worked through for one position size, isolated margin, an asset with 40x maximum leverage (maintenance margin 1.25%), entry at $100,000:
| Leverage | Long liquidates at | Distance | Short liquidates at | Distance |
|---|---|---|---|---|
| 5x | $81,013 | −19.0% | $118,519 | +18.5% |
| 10x | $91,139 | −8.9% | $108,642 | +8.6% |
| 20x | $96,203 | −3.8% | $103,704 | +3.7% |
| 25x | $97,215 | −2.8% | $102,716 | +2.7% |
| 40x | $98,734 | −1.3% | $101,235 | +1.2% |
That table is the whole idea of a heatmap. If many traders opened longs near $100,000, and many of them chose 10x, 20x or 25x, their liquidation prices cluster at a handful of levels below. The heatmap tries to estimate where those clusters are and how large.
How heatmaps are built
The difficulty is that centralized exchanges do not publish individual liquidation prices. As indicator vendor LuxAlgo puts it, “Exchanges do not disclose individual liquidation prices,” so maps on those venues “are estimates built from open-interest changes and assumed leverage distributions.” Open interest, in CME’s definition, is “the total number of futures contracts held by market participants”; when it rises at a price, new positions were opened there.
What the main providers say about their own maps:
| Provider | What it says it shows | Inputs it names |
|---|---|---|
| CoinGlass | It “predicts where liquidations might be triggered, not the actual number of liquidations”; levels are “a relative intensity indicator” | “Market trading volume, leverage usage, and other relevant market data”; set per exchange and pair (Binance BTCUSDT by default), over windows from 12 hours to 1 year |
| Glassnode | “Estimated liquidation risk from perpetual futures across price levels,” in 100 price buckets; “brighter zones highlight larger notional at risk” | “Recent open-interest flows and price moves,” aggregated across exchanges |
| Hyblock | “Estimates of potential price levels where liquidation events may occur” | Filters by exchange, leverage and position; methodology not published |
| The Kingfisher | “Model-estimated liquidation pressure”; “All liquidation levels remain estimates” | Proprietary: its “private inputs, weightings and transformations are not published” |
| CoinMarketCap (Hyperliquid) | Actual positions: “It is not modeled” | “The liquidation levels of every open Hyperliquid position are read from the chain roughly every 5 minutes” |
CoinGlass offers three models alongside its main heatmap. Its API documentation describes Model 1, 2 and 3 in identical words, so from public material there is no way to tell how they differ.
The last row is the exception worth knowing. Hyperliquid’s positions are public, so CoinMarketCap can show “the exact levels rather than an estimate.” Hyperliquid’s own API exposes each account’s liquidation price. On a decentralized venue, the map can be a ledger. On Binance, Bybit or OKX, it cannot.
How to read one
- Colour is relative. CoinGlass shifts “from low-intensity purple to high-intensity bright yellow,” and asks you to compare a level “with estimated liquidation volumes at other price levels.” CoinMarketCap: “Brightness is relative to what is currently on screen.” A yellow band on a quiet day may be smaller than a purple band in a crowded week.
- Check the scope. Which exchange or exchanges, which pair, which time window. A Binance-only BTCUSDT map over 24 hours and an aggregated map over three months describe different things.
- Longs sit below, shorts above. Bands below the price are long positions that would be liquidated in a fall; bands above are shorts that would be liquidated in a rally.
- Bands decay. Positions close, get topped up or get liquidated; an old band may describe positions that no longer exist.
Why the bands are not a forecast
They overstate. CoinGlass: “the actual number of forced liquidations is often lower than the intensity indicated by the heatmap.”
Positions move their own liquidation price. OKX lists the causes: “manually adding or removing margin,” “funding fee settlement,” and adding to a position, which “merges with the existing position into a single position” with a new average entry. Under cross margin, “price moves in the other underlyings will also affect the estimated liquidation price.” A trader who tops up margin as price approaches simply moves their band.
Liquidations are partial. Hyperliquid sends only 20% of a large position (over 100,000 USDC) to the book at first, with a 30-second cooldown. OKX steps positions down by tiers. Binance can reduce a position “without fully liquidating” it. A band does not disappear in one candle.
The losses go somewhere else when liquidity runs out. If a liquidated position cannot be closed above its bankruptcy price, the exchange’s insurance fund covers the gap, and if that is not enough, auto-deleveraging closes profitable traders on the other side. OKX “ranks users by profit rate and leverage and reduces the positions of profitable users on the opposite side.” Hyperliquid closes them “at the previous mark price.”
Providers disagree. LuxAlgo: “Different providers show meaningfully different maps.” They model different exchanges with different assumptions.
Price has to get there. Even an exact onchain level, as CoinMarketCap notes, means “nothing happens at that price unless the market reaches it.”
The “magnet” claim
CoinGlass says that in “magnetic zones” prices “tend to gravitate towards these areas.” LuxAlgo calls it “a tendency, not a rule.” We found no rigorous public study that tests it.
There is a mechanical reason a band can matter once price reaches it: liquidations are executed as market orders into the book, so a cluster of them pushes price further in the same direction, possibly into the next cluster. That is a cascade, and it explains why moves accelerate through bands. It does not show that price is drawn to a band before it gets there.
October 10–11, 2025: every number is an estimate
The largest liquidation event on record shows how uncertain even the realized figures are.
| Figure | Source |
|---|---|
| About $9.55 billion of open interest erased by the evening of October 10 (US time) | CoinGlass, via The Block |
| About $19.1 billion liquidated, roughly $16.7 billion of it longs | CoinDesk, via Decrypt |
| More than 1.6 million accounts liquidated | The Defiant |
| Bitcoin fell from $118,000 to $101,000 “in the span of a few hours” | Decrypt |
| Some estimates “above $30 billion” | Multicoin Capital’s Brian Strugats, via Global Trade |
CoinGlass itself said the total was “likely much higher” because “Binance only reports one liquidation order per second.” That is documented: Binance’s public liquidation stream pushes “only the latest one liquidation order within 1000ms” per symbol. Hyperliquid’s founder Jeff Yan argued that “this could easily be 100x under-reporting under some conditions.” Treat that as his claim.
Two more lessons from that night:
- Auto-deleveraging hit winners. A research paper by Tarun Chitra, published on arXiv, found Hyperliquid’s ADL was “used repeatedly to close $2.1 billion of positions in 12 minutes,” and that profitable traders lost between $45.0 million and $51.7 million in excess profits as a result.
- Collateral can break. USDe, BNSOL and WBETH depegged on Binance, with USDe briefly below $0.66. Binance paid about $283 million in compensation to users affected between 21:36 and 22:16 UTC, and said “the extreme market downturn occurred before the de-pegging.” Positions margined in those assets were measured against collateral that was suddenly worth less.
No heatmap showed any of that in advance.
Onchain lending: the visible kind
DeFi lending has liquidations too, and they work differently. On Aave, “when the ‘health factor’ of an account’s total loans is below 1, anyone can make a liquidationCall().” Under the default close factor, a liquidator can repay at most 50% of a position’s debt in one go, and receives a liquidation bonus “evaluated and determined based on each asset’s liquidity risk.” Aave v4 changes that to a Dutch auction in which “lower health factors result in higher liquidation bonuses.”
Because these positions are public, their liquidation levels can be computed exactly from chain data and Aave’s oracle prices. That is the same advantage CoinMarketCap’s Hyperliquid map has over every centralized one.
Funding, the other running cost of leverage, also drags positions toward their liquidation price over time; How perpetual futures funding rates work shows by how much.
Using a heatmap without fooling yourself
| Question | Why it matters |
|---|---|
| Is this map modeled or onchain? | Centralized-exchange maps are estimates; onchain maps show real positions |
| Which exchanges, pair and window? | Scope changes the picture more than the colours do |
| How bright, relative to what? | Intensity is relative to the view or the period |
| Do other providers agree? | Different models, different bands; agreement is a weak signal, disagreement a strong warning |
| Where is my own liquidation price, on mark price? | Your band is the one that matters; keep it well away from the crowded ones |
| What is my plan if price runs through a band? | Cascades move fast; partial liquidations and ADL do not wait for you |
Sources
- 01Liquidation (USDⓈ-M futures) · Binancewww.binance.com/en/support/faq/liquidation-360033525271
- 02Forced liquidation FAQ · OKXwww.okx.com/help/forced-liquidation-faq
- 03Liquidations · Hyperliquid Docshyperliquid.gitbook.io/hyperliquid-docs/trading/liquidations
- 04Margining · Hyperliquid Docshyperliquid.gitbook.io/hyperliquid-docs/trading/margining
- 05Auto-deleveraging · Hyperliquid Docshyperliquid.gitbook.io/Hyperliquid-docs/trading/auto-deleveraging
- 06Open interest · CME Groupwww.cmegroup.com/education/courses/introduction-to-futures/open-interest.html
- 07Liquidation clusters · LuxAlgowww.luxalgo.com/library/concept/liquidation-clusters.md
- 08CoinGlass introduction (liquidation heatmap) · CoinGlasswww.coinglass.com/learn/coinglass-intro-en
- 09How to use the liquidation map to assist trading · CoinGlasswww.coinglass.com/learn/how-to-use-liqmap-to-assist-trading-en
- 10Liquidation heatmap API (models, exchanges, ranges) · CoinGlass API Docsdocs.coinglass.com/reference/liquidation-heatmap
- 11Derivatives endpoints (liquidation heatmap) · Glassnode Docsdocs.glassnode.com/basic-api/endpoints/derivatives
- 12Liquidation levels · Hyblock Capital Docsdocs.hyblockcapital.com/liquidation-levels
- 13LiqMap · The Kingfisherthekingfisher.io
- 14Liquidation heatmap (Hyperliquid, onchain) · CoinMarketCapcoinmarketcap.com/charts/liquidation-heatmap/
- 15Liquidation map (Hyperliquid, exact levels) · CoinMarketCapcoinmarketcap.com/charts/liquidation-map/
- 16All market liquidation order streams · Binance Developersdevelopers.binance.com/docs/derivatives/usds-margined-futures/websocket-market-streams/All-Market-Liquidation-Order-Streams
- 17Crypto liquidations near $10 billion in historic drawdown · The Blockwww.theblock.co/post/374266/crypto-liquidations-near-10-billion-in-historic-drawdown-following-trumps-100-tariffs-on-china
- 18Hyperliquid founder says certain CEXs may underreport liquidations · The Blockwww.theblock.co/post/374311/hyperliquid-founder-says-certain-cexs-may-underreport-liquidations
- 19$19B wiped out in crypto's biggest liquidation ever · Decryptdecrypt.co/344038/morning-minute-19b-wiped-out-in-cryptos-biggest-liquidation-ever
- 20The ultimate 10/10 crash autopsy · The Defiantthedefiant.io/newsletter/defi-daily/the-ultimate-10-10-crash-autopsy
- 21Crypto market sees historic $19B liquidation · Global Tradewww.globaltrademag.com/crypto-market-sees-historic-19b-liquidation-after-trump-tariffs/
- 22Auto-deleveraging on Hyperliquid, October 10 2025 (Chitra, arXiv 2512.01112) · arXivarxiv.org/abs/2512.01112v3
- 23Binance pays $283 million in compensation following depegs · The Blockwww.theblock.co/amp/post/374295/binance-pays-283-million-in-compensation-following-fridays-depegs-covering-user-losses
- 24Liquidations (health factor, close factor, bonus) · Aave Docsdocs.aave.com/developers/guides/liquidations
- 25Liquidations in Aave v4 · Aaveaave.com/docs/concepts/liquidations
Responses
No responses yet. Start the conversation.
Panther Journal — The intelligence brief
Stay ahead of the story.
Free. New investigations delivered when published. Unsubscribe anytime.